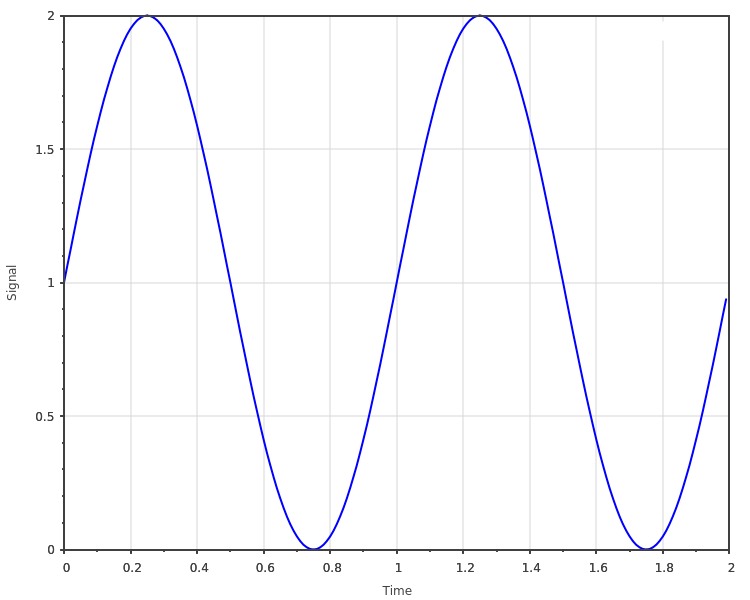
scicpp::plots::plot
Defined in header <scicpp/plots.hpp>
Basic plot.
Return a sciplot::Plot2D object.
Example
#include <scicpp/core.hpp>
#include <scicpp/plots.hpp>

namespace sci = scicpp;
namespace plt = sci::plots;

int main() {
   using namespace sci::operators;
   using namespace sci::units::literals;

   const auto t = sci::arange(0.0, 2.0, 0.01);
   const auto s = 1.0 + sci::sin(2_rad * sci::pi<double> * t);

   auto plot = plt::plot(t, s);
   plot.xlabel("Time");
   plot.ylabel("Signal");
   plot.fontSize(12);
   plot.size(500, 500);
   plot.show();
}
