scicpp::plots::hist
Defined in header <scicpp/plots.hpp>
Plot a histogram.
Return a sciplot::Plot2D object.
-
template<bool
density= false, booluse_uniform_bins= false, typenameArray>
autohist(const Array &x, const std::vector<T> &bins)
Plot the histogram of a dataset defined by an array x for a given set of bins.
-
template<stats::BinEdgesMethod
method, booldensity= false, typenameArray>
autohist(const Array &x)
Plot the histogram of a dataset defined by an array x and compute the bins using a given BinEdgesMethod.
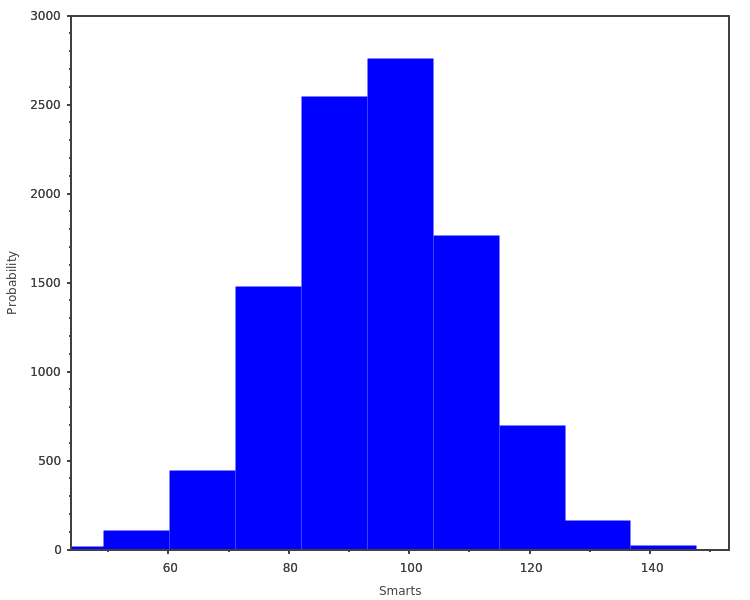
Plot the histogram of a dataset defined by an array x using a number of bins nbins (default 10).
Example
#include <scicpp/core.hpp>
#include <scicpp/plots.hpp>

namespace sci = scicpp;
namespace plt = sci::plots;

int main() {
    using namespace sci::units::literals;
    using namespace sci::stats;

    const auto x = sci::random::normal<10000>(100., 15.);

    // Plot basic histogram
    auto plot0 = plt::hist(x);
    plot0.xlabel("Smarts");
    plot0.ylabel("Probability");
    plot0.fontSize(12);
    plot0.size(500, 500);
    plot0.show();
    // plot0.save("hist.pdf");

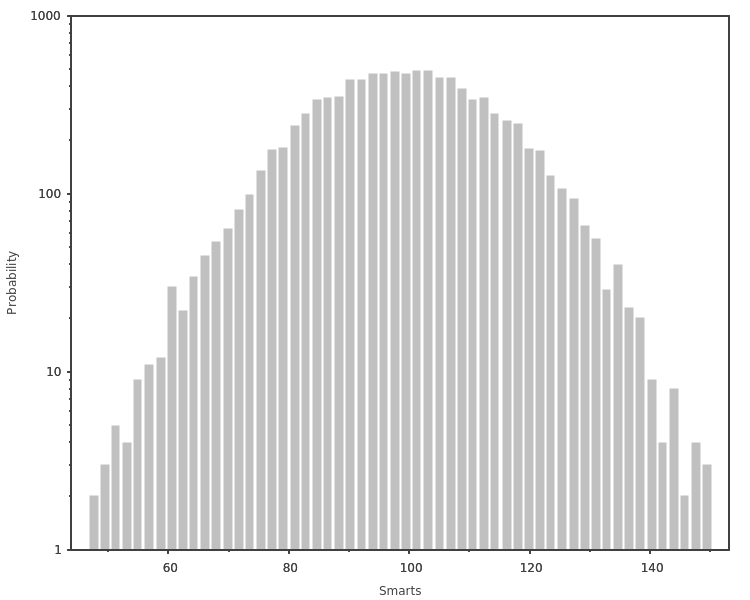
    // Plot logscale histogram with auto bin
    auto plot1 = plt::hist<BinEdgesMethod::AUTO>(x);
    plot1.color("grey");
    plot1.log(true);
    plot1.rwidth(0.75);
    plot1.xlabel("Smarts");
    plot1.ylabel("Probability");
    plot1.fontSize(12);
    plot1.size(500, 500);
    plot1.show();

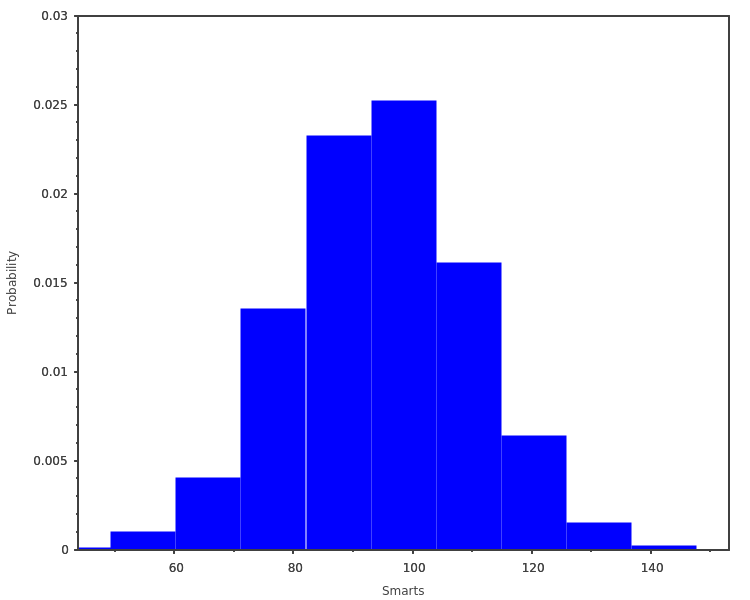
    // Plot histogram of data with units
    const auto V = sci::random::normal<10000>(100_V, 15_V); // Voltage noise data
    auto plot2 = plt::hist<Density>(V);
    plot2.xlabel("Smarts");
    plot2.ylabel("Probability");
    plot2.fontSize(12);
    plot2.size(500, 500);
    plot2.show();
}


- See also
- Matplotlib documentation