EEG signal
This example is inspired from https://raphaelvallat.com/bandpower.html.
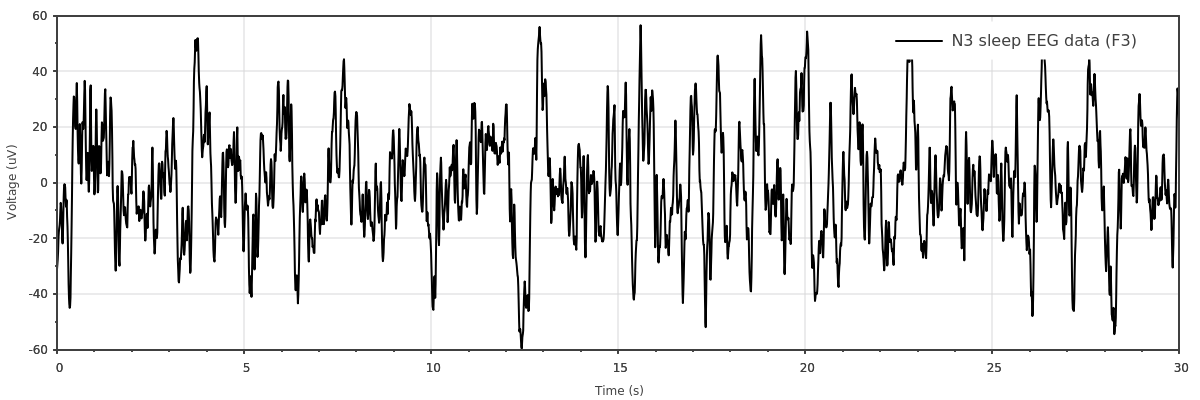
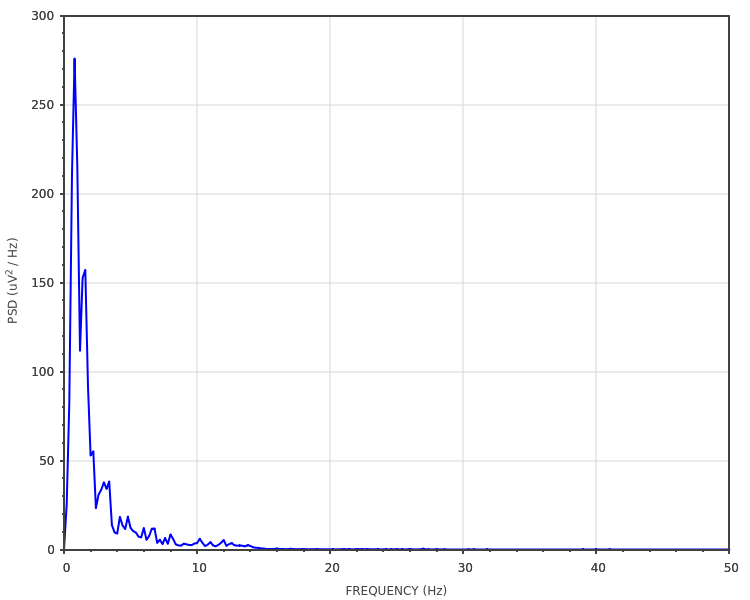
Here, we load EEG data, plot them and then compute its periodogram:
#include <scicpp/core.hpp>
#include <scicpp/plots.hpp>

namespace sci = scicpp;
namespace plt = sci::plots;
namespace sig = sci::signal;

int main() {
    using namespace sci::operators;
    using namespace sci::units::literals;

    // ---- Loading data (The signal is in microvolts)
    const auto eeg_signal = sci::TxtLoader<sci::units::microvolt<>>()
                            .skiprows(1)
                            .load_vector("examples/eeg-data.txt");

    // Sampling frequency and time vector
    constexpr auto fs = 100_Hz;
    const auto time = sci::arange(0.0, double(eeg_signal.size())) / fs;

    auto plot1 = plt::plot(time, eeg_signal);
    plot1.color("black");
    plot1.ylabel("Voltage (uV)");
    plot1.xlabel("Time (s)");
    plot1.fontSize(12);
    plot1.label("N3 sleep EEG data (F3)");
    plot1.show(1200, 400);

    // ---- Welch's periodogram
    // Configure the spectrum analyzer
    auto spec = sig::Spectrum{}
                .fs(fs)
                .window(sig::windows::Boxcar, time.size() / 6);

    auto plot2 = plt::psd<sig::DENSITY, plt::LINEAR>(spec, eeg_signal);
    plot2.size(1000, 500);
    plot2.xlabel("FREQUENCY (Hz)");
    plot2.ylabel("PSD (uV^2 / Hz)");
    plot2.show();
}
The resulting plot of the signal:

The power spectral density in linear scale:
